Quantifying and understanding Europe's greenhouse gas balance
For the first time in history, the European environmental research community is working together to establish a consolidated greenhouse gas (GHG) observation network for the next 20 years. The data produced will be freely available and enable us not only to constrain the GHG balance of Europe precisely, but also to understand the current and future Earth system.
Measurements of greenhouse gases (GHGs), whether performed in the atmosphere, or over terrestrial or marine ecosystems, have led to a fundamental understanding of the Earth System during the last century. Nevertheless, we still do not fully understand global greenhouse gas cycling. Up to date measurements of GHG are still rare (as observation sites are few) or often non-standardized. The first step towards such standardized measurements in Europe has now been achieved within the Integrated Carbon Observation System (ICOS) [1] [2].
Standardized GHG observations across Europe
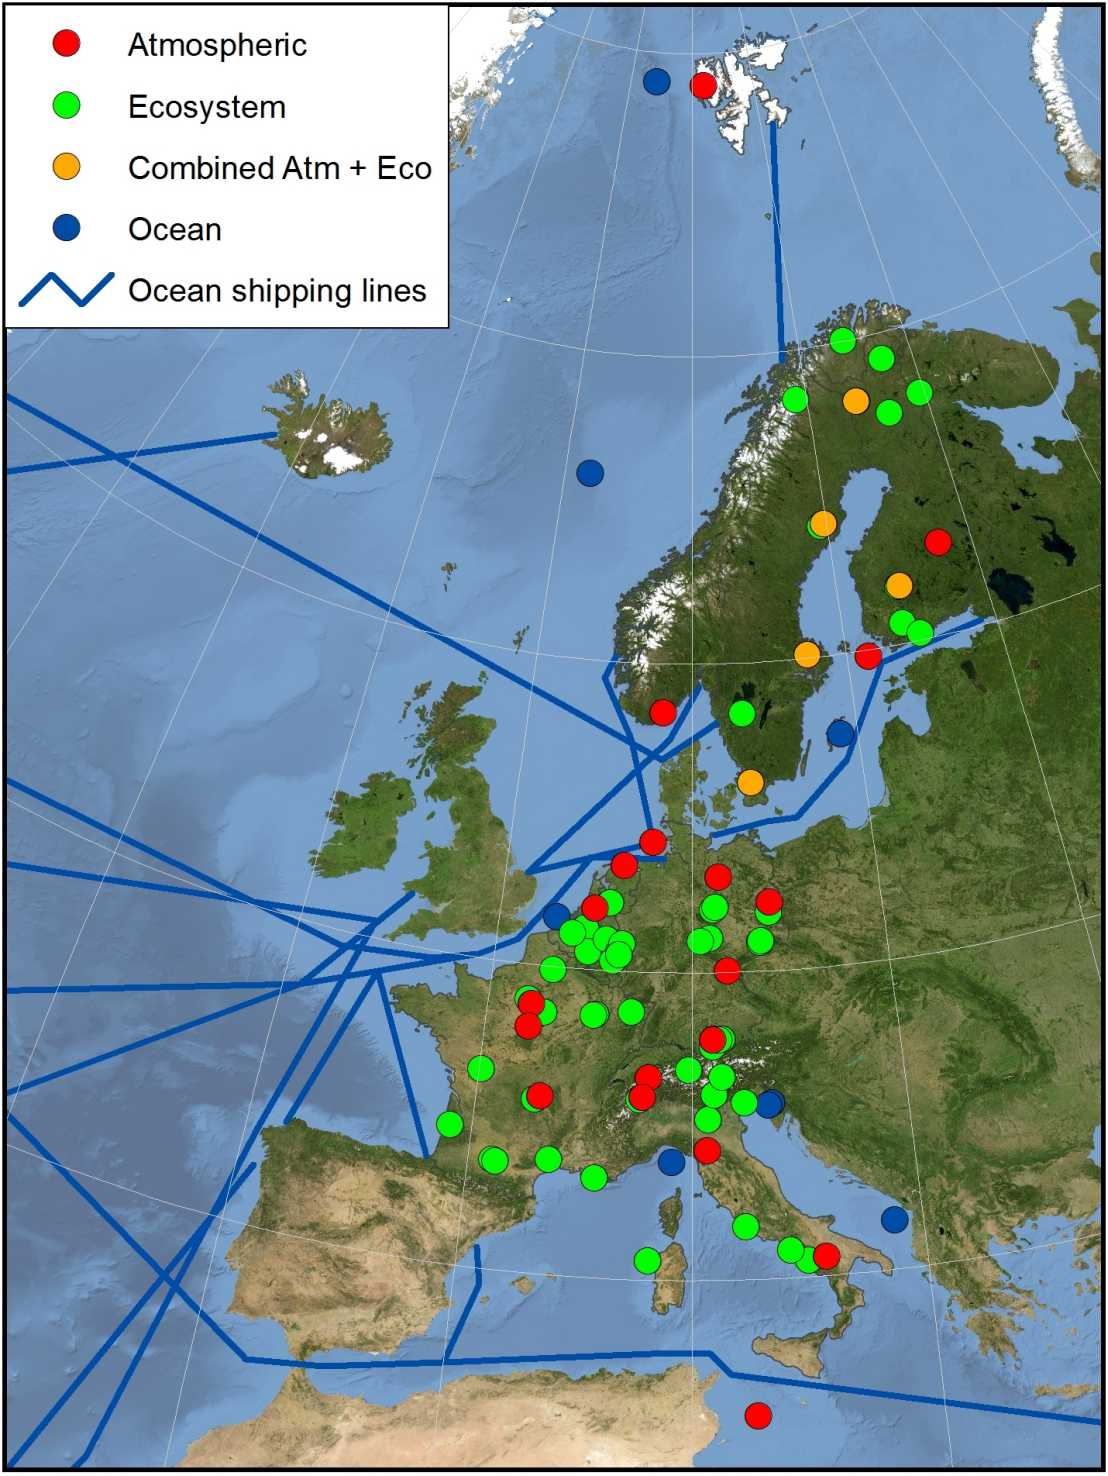
The Integrated Carbon Observation System (ICOS) is a distributed research infrastructure (RI) [3] that aims at providing long-term (+ 20 years), standardized European-wide measurements on the carbon cycle, on atmospheric GHG concentrations and associated fluxes. The ICOS-RI integrates atmosphere, ecosystem and ocean GHG monitoring networks in order to fully observe the European carbon balance and its perturbations. Standardized measurements are carried out throughout Europe – at tall atmospheric towers and ecosystem sites ranging from the Arctic (Spitzbergen) to the Mediterranean (Lampedusa), as well as on ocean platforms and vessels covering the North Atlantic, the Mediterranean Sea and the Baltic Sea.
In this way, ICOS-RI sets standards comparable to World Meteorological Organization (WMO) measurements of air temperature. At the same time, bottom-up (GHG flux measurements carried out on the ground) and top-down (atmospheric GHG concentrations measurements together with inversion models) approaches are used to integrate the observations across the continent. All data collected within ICOS-RI will be freely accessible and open-source to stakeholders, scientists and any individual worldwide, via a one-stop data shop – the Carbon Portal [4].
The founding member countries of ICOS-RI are Finland, Sweden, Norway, Germany, France, Belgium, Italy, and Switzerland, who joined as a founding observer. Other countries, such as the Netherlands, the United Kingdom and the Czech Republic are currently in the process of joining the consortium.
The Swiss contribution to ICOS

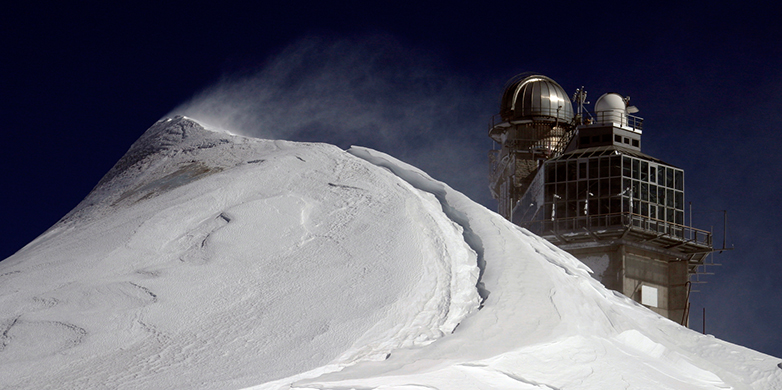
ICOS Switzerland external pageICOS-CH is the Swiss contribution to this European RI, with GHG measurements being carried out at two unique locations: Jungfraujoch (atmospheric station) and Davos-Seehornwald (ecosystem station). Several research institutes collaborate in ICOS-CH: ETH Zurich, the Swiss Federal Institute for Materials Science and Technology (EMPA), the Swiss Federal Institute for Forest, Snow and Landscape Research (WSL), the Federal Office of Meteorology and Climatology (MeteoSwiss), the University of Bern and the University of Basel.
Why long-term GHG measurements at all?
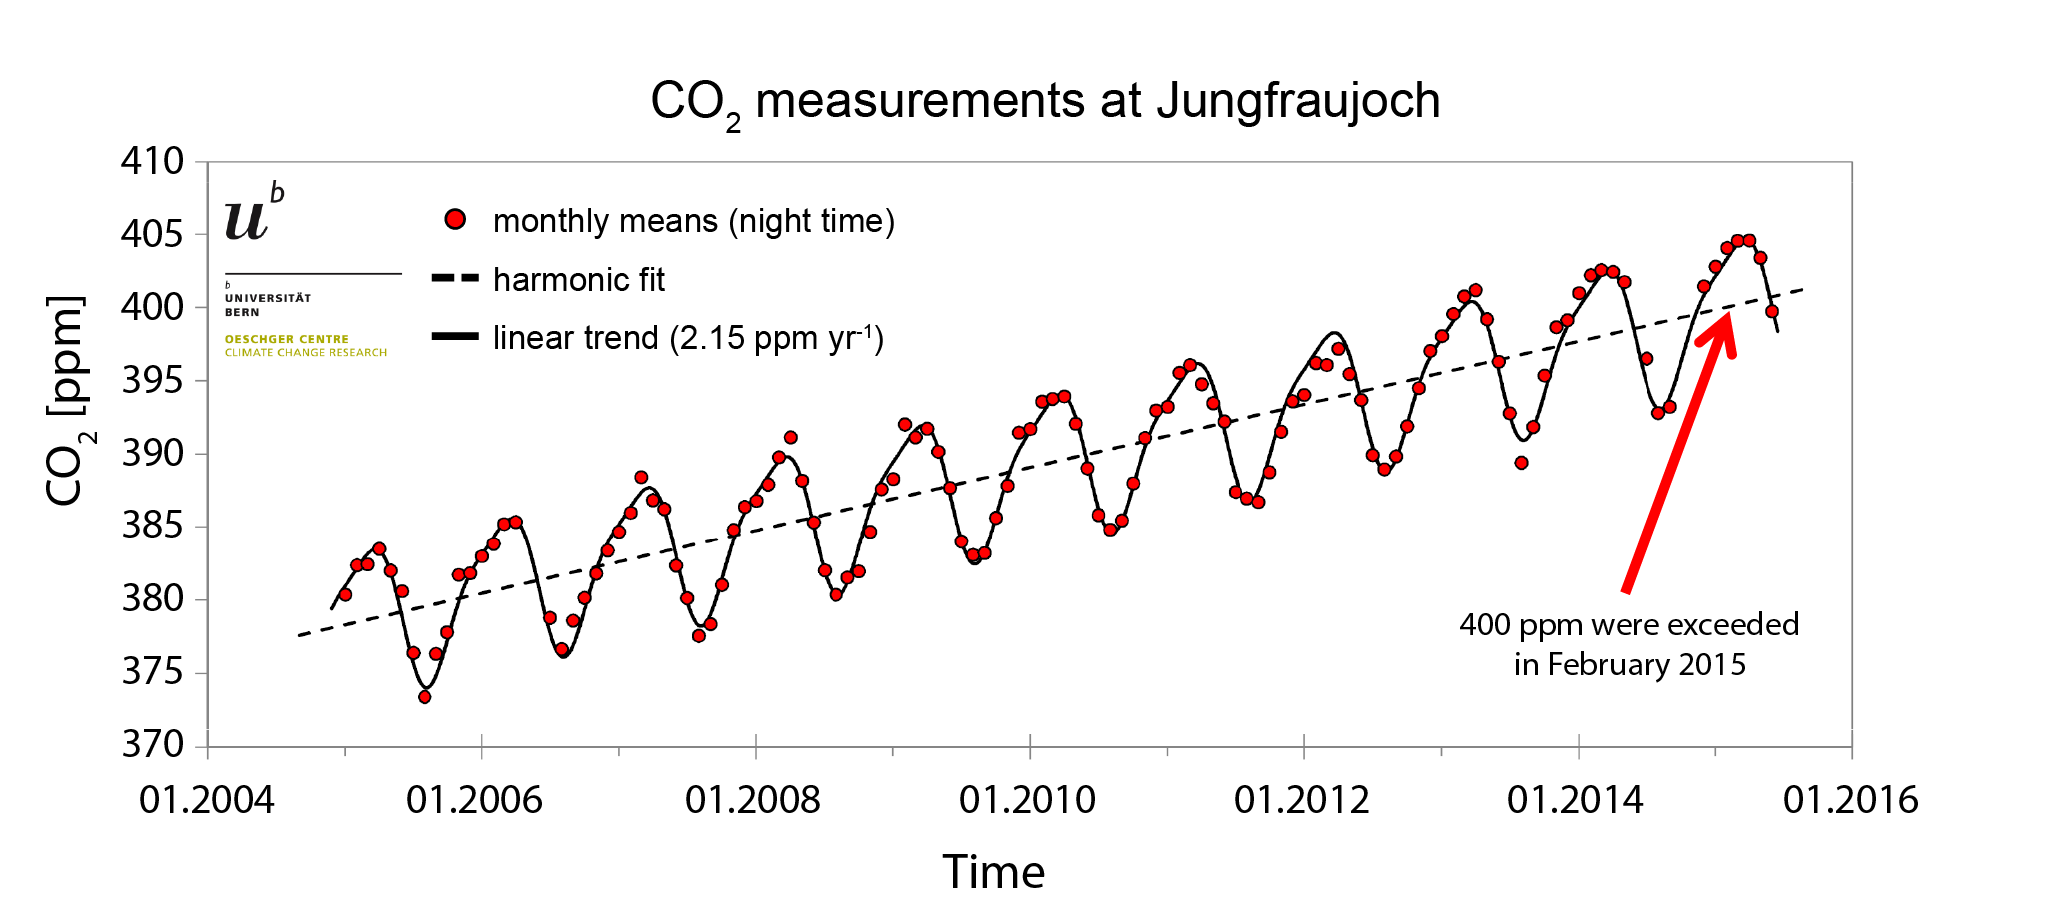
Probably the best known example of a long-term atmospheric watch is the uninterrupted measurement of CO2 from the Mauna Loa observatory in Hawaii, which shows the current atmospheric trend since the late 1950s.
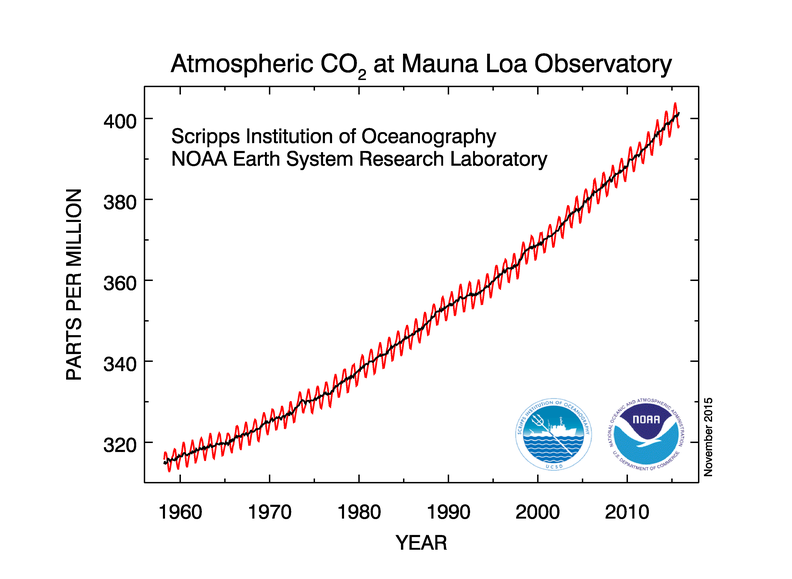
This curve is often used to show the direct link between rising atmospheric greenhouse gas concentrations and rising temperatures across the globe. A similar dataset – though not as long as the Mauna Loa dataset – is provided by measurements carried out at Jungfraujoch here in Switzerland (see next figure). These datasets show not only the long-term trend in GHG concentrations, but also variations within the year. The annual variation is primarily caused by predominant CO2 uptake via photosynthesis during summer in the Northern hemisphere and CO2 losses during winter.
There are many other examples where ground-based (“in-situ”) observations have provided detailed insights into global, continental and regional carbon cycling. Atmospheric and ecosystem GHG observations, similar to those carried out by the Grassland Sciences Group at ETH, have revealed that between 7-12% of the European fossil fuel emission are again taken up via photosynthesis by the European biosphere [5]. In addition, field observations have succeeded in quantifying the effects of extreme climatic events, such as the 2003 heat wave in Europe, on ecosystems carbon cycling [6] and in identifying the overall sink strength of forests and grasslands in Europe [7].
What we know and what we don’t know about the carbon cycle
To date, we know reasonably well how much carbon in the form of CO2 and CH4 is released via anthropogenic activities (such as electricity, industry and land use) as well as how much trace gases are emitted or consumed by terrestrial and aquatic systems. In fact, we know that roughly one third of the additionally released carbon can be found in the atmosphere, and another third can be found in the oceans. The remaining third most likely ends up in the terrestrial biosphere, and is often referred to as the missing sink. Yes, that’s right: we don’t know exactly where the additional third of emitted carbon is recycled within the natural system, although boreal forests or the tropics are possible candidates.
So this highlights a major drawback of our understanding of GHG cycling, namely that we lack a fine-scale resolution of sources and sinks, as well as information on how these sources and sinks vary over time.
An integrated measurement approach is needed
Currently available data streams comprise measurements from individual research groups across the globe, or loose networks of researchers providing their data in large databases [8]. However, data are often collected within short-term research projects (mostly of 3 years duration) where the research focus is very specific and individual, leading to discontinuous and often non-comparable data streams. I myself have been working on several such projects focusing on unique ecosystems across the globe. These systems are often difficult to reach and huge effort is taken to set up a GHG observation site. After only 1 or 2 years, all equipment is usually dismantled and sent back to the lab, due to a lack of continuous funding. Long-term observations – as provided by the Rothamsted Experimental Station [9] for 170 years in the field of agricultural research – do not currently exist for GHG observations.
All in all, the type of activities currently tackled within ICOS-RI are very much needed for quantifying and understanding Europe’s greenhouse gas balance.
Further information
[1] Integrated Carbon Observation System external pageICOS
[2] The Press Release is available at ICOS-CH
[3] external pageResearch infrastructures (RI) are facilities, resources and related services used by the scientific community to conduct top-level research in their respective fields. Their development has been coordinated through the European Strategic Forum on Research Infrastructures (ESFRI) since 2004.
[4] The external pageCarbon Portal
[5] I. A. Janssens et al., Europe's terrestrial biosphere absorbs 7 to 12% of European anthropogenic CO2 emissions. Science 300, 1538-1542 (2003).
[6] P. Ciais et al., Europe-wide reduction in primary productivity caused by the heat and drought in 2003. Nature 437, 529-533 (2005).
[7] E. D. Schulze et al., Importance of methane and nitrous oxide for Europe's terrestrial greenhouse-gas balance. Nature Geoscience 2, 842-850 (2009).
[8] Predominant examples are the external pageFLUXNET network from the ecosystem community, the WMO supported external pageGlobal Atmosphere Watch program running standardized observations sites globally and the “Surface Ocean CO2 Variability and Vulnerability” network from the ocean research community (external pageSOCAT).
[9] external pageRothamsted Experimental Station