Sensors take the tram
For almost two years, researchers at ETH Zurich have been measuring air quality along tram lines in Zurich. They have now presented maps that for the first time show precisely when and where air pollution in Zurich is at its highest.
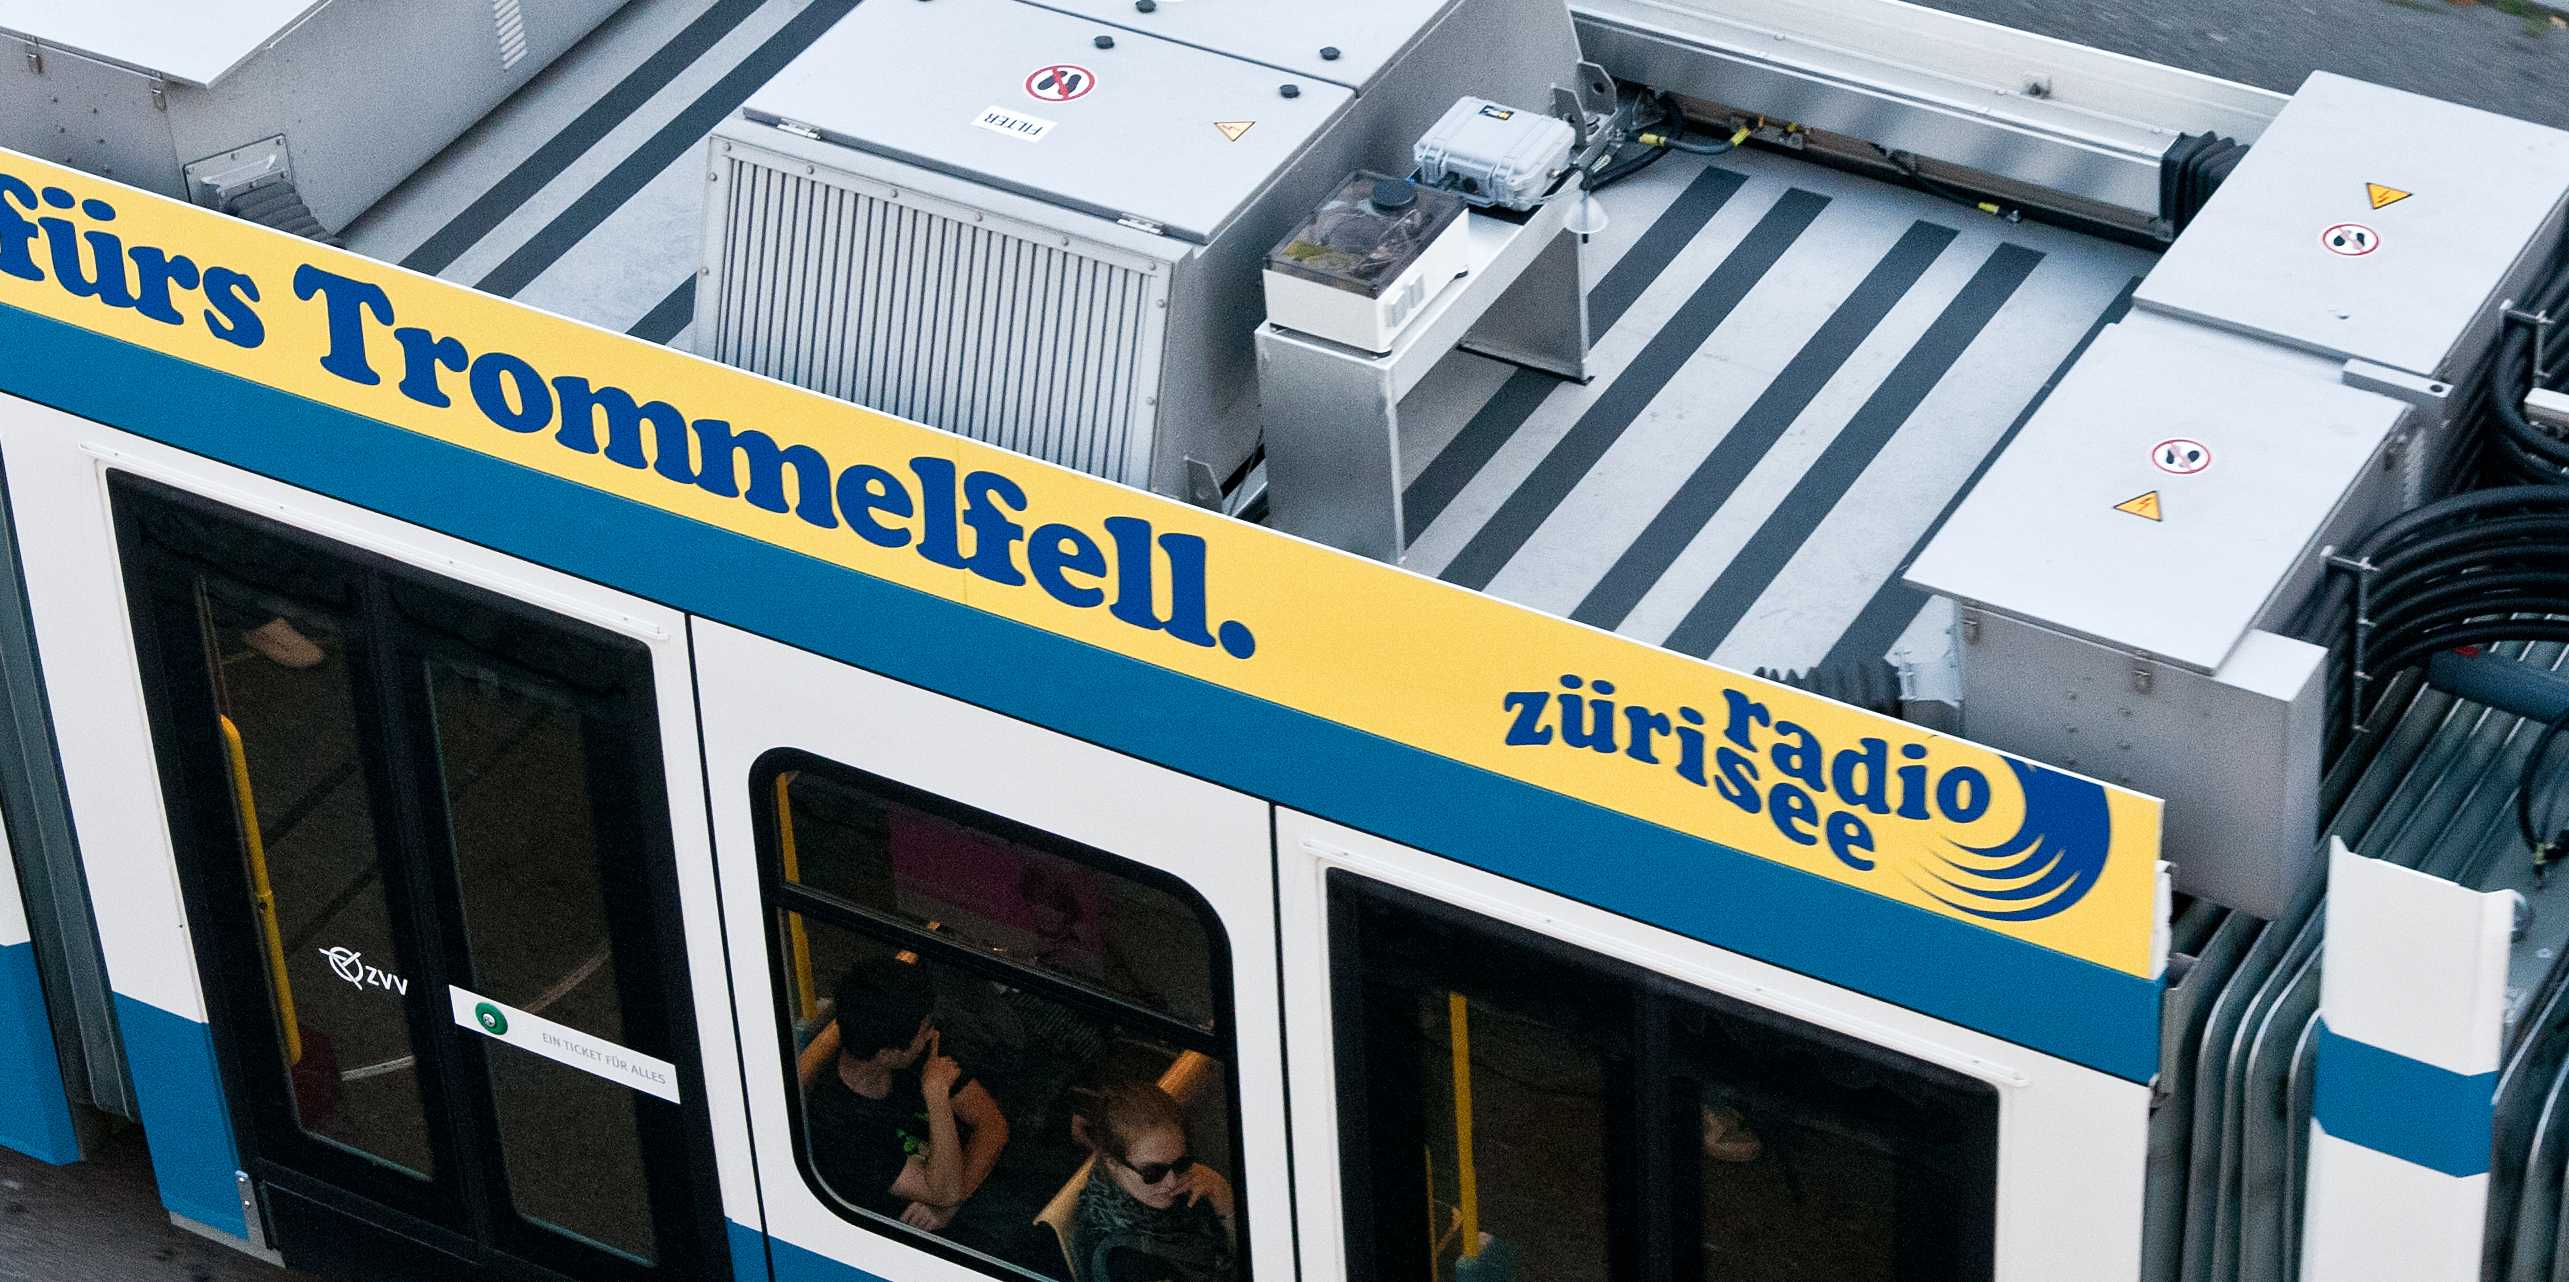
About 200 million passengers a year use the tram as a means of transport in Zurich. However, in the interests of science, some of the trams also have ‘fare dodgers’ on board: Ten VBZ trams carry not only passengers but also serve as mobile air quality measurement stations. Small boxes mounted on the trams’ roofs have been tirelessly providing data about air quality for almost two years. The measurement stations are operated by researchers working under Lothar Thiele, professor at ETH Zurich’s Computer Engineering and Networks Laboratory, as part of the Opensense project. The research team has now presented the first detailed maps of air quality in Zurich, created with the help of this data.
Measurement station in a shoebox
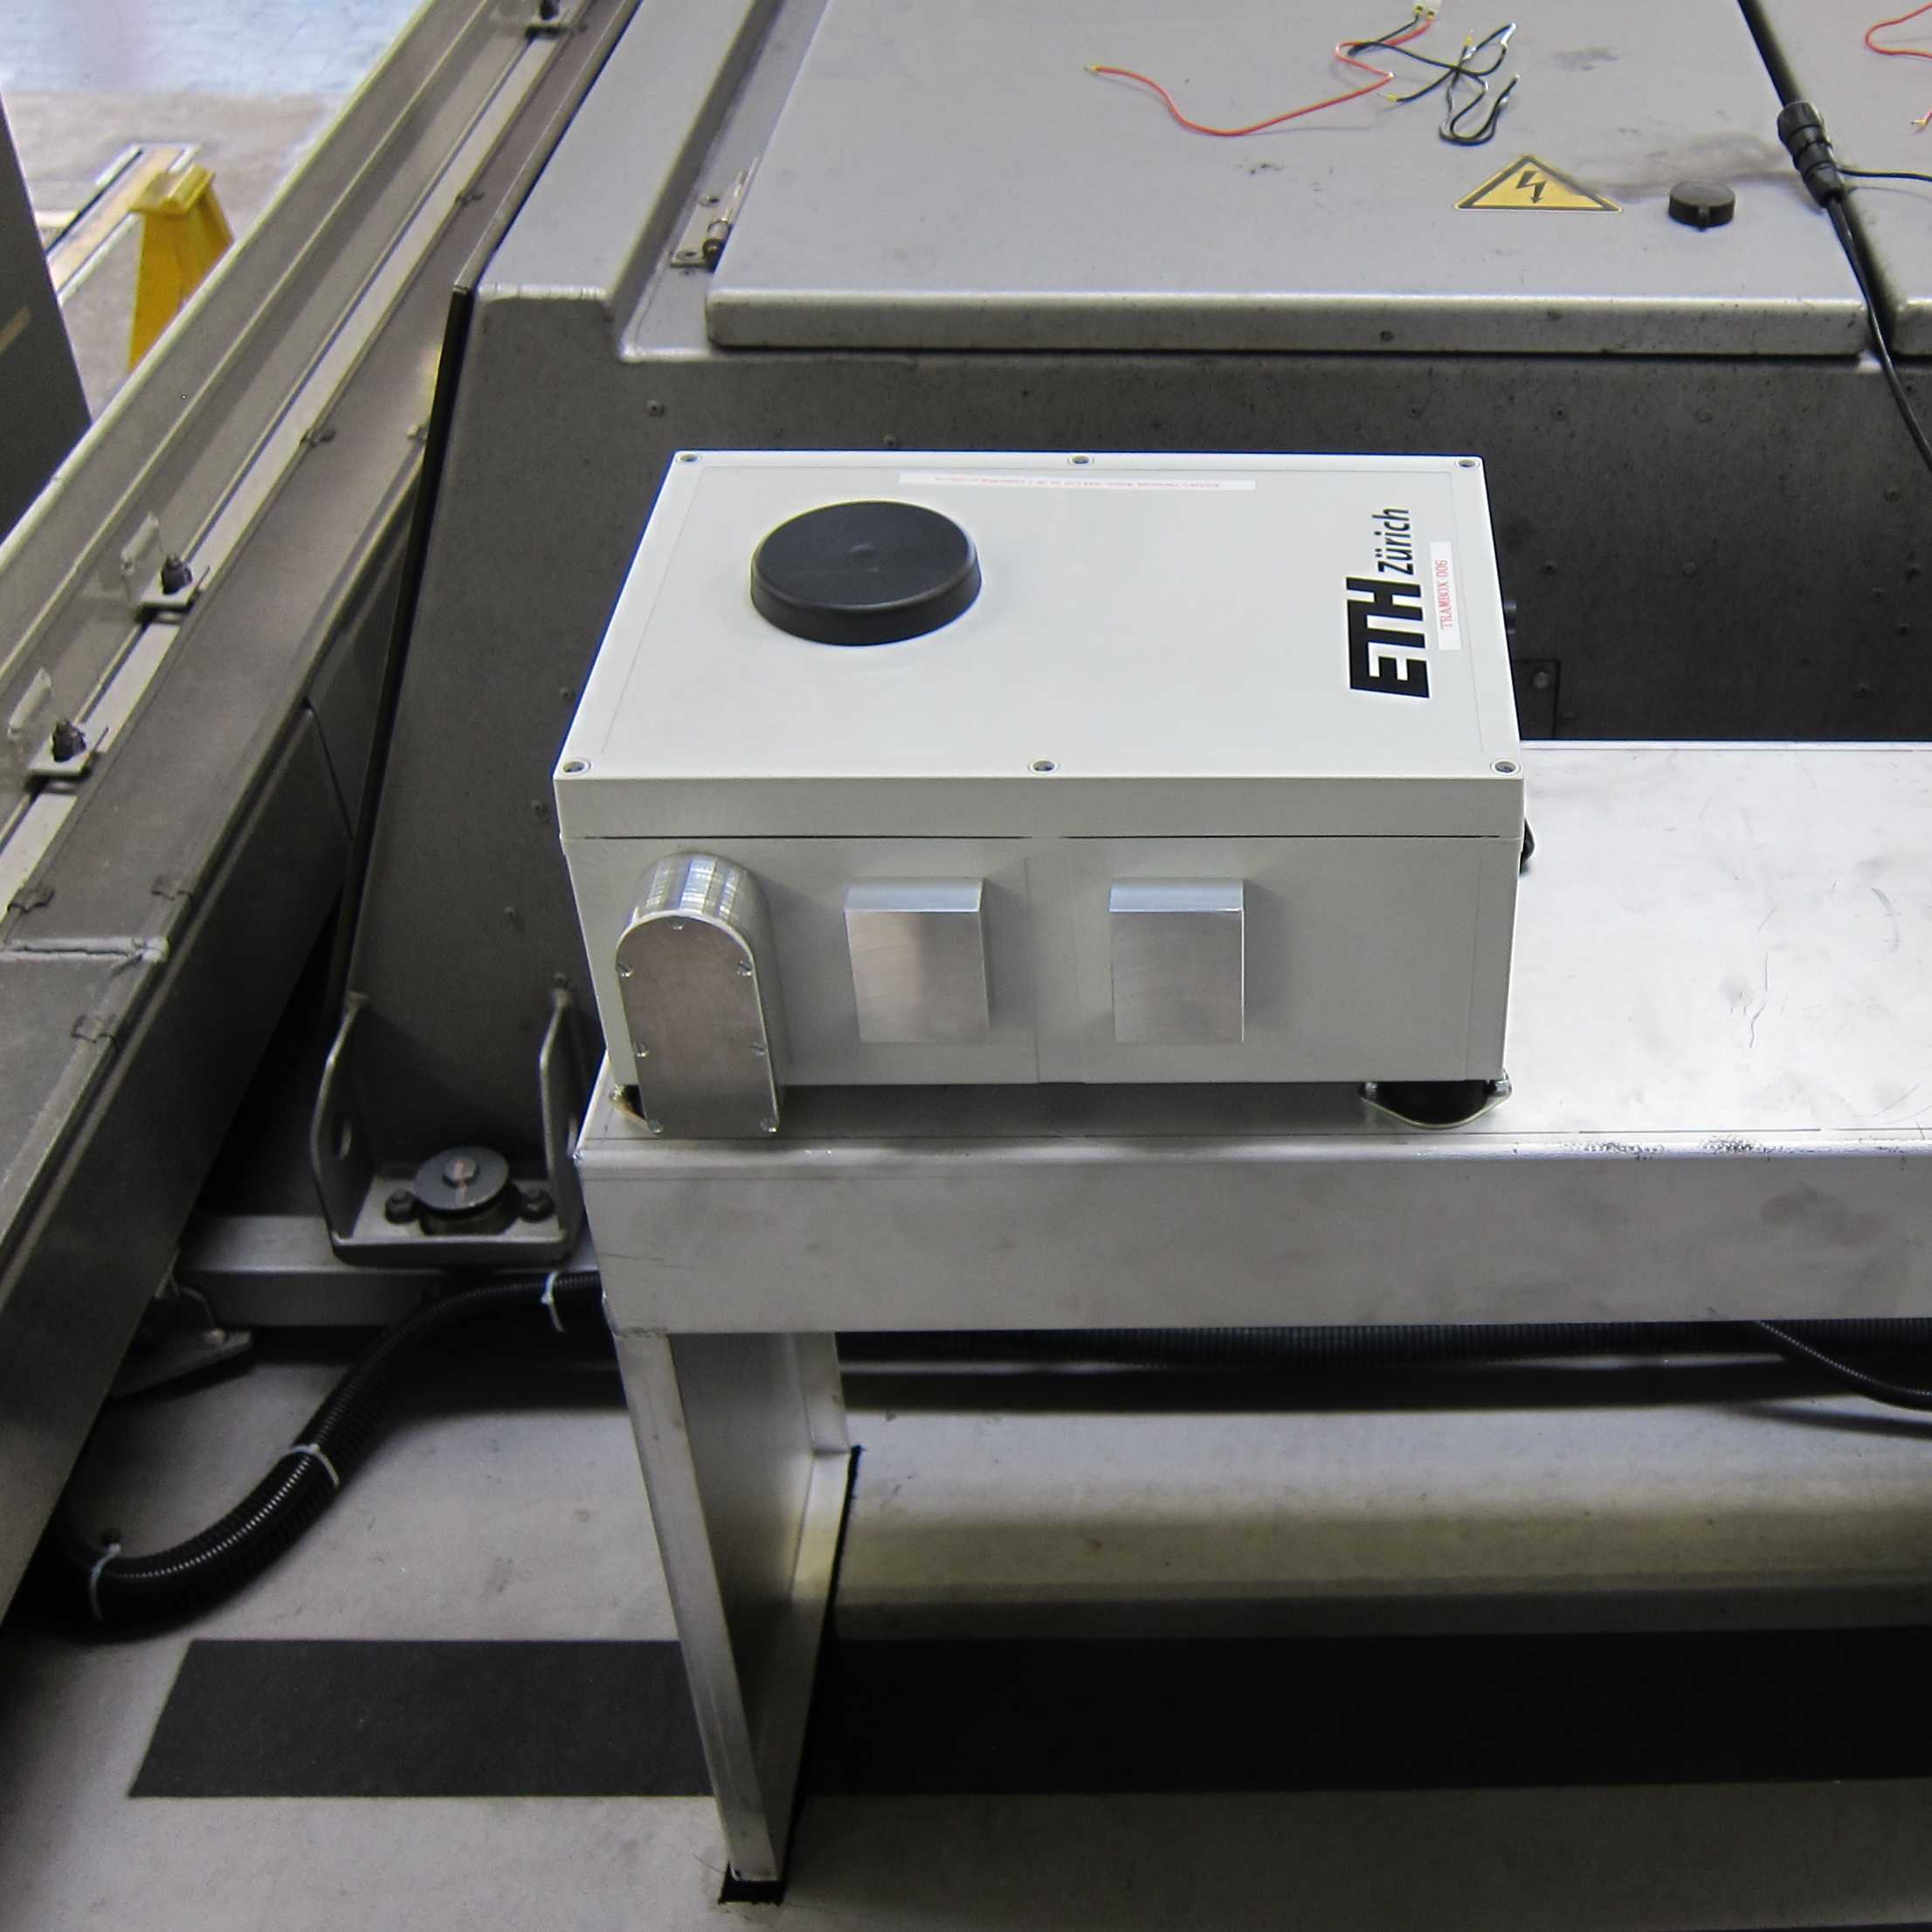
Olga Saukh, David Hasenfratz and Christoph Walser, members of Thiele’s team, have an impressive data pool of 30 million measurements at their disposal. The data is unique, as it shows the entire city zone in an unprecedented density. The shoebox-sized nodes record the proportion of ozone, carbon monoxide and ultrafine particles in the air, and take a measurement every five seconds on average. The researchers measure the air quality at distances of about 50 metres while the tram is moving. In order to take this many measurements, the team had to develop special measurement boxes suitable for mobile use. “It was very challenging to find sensors that were the right size and could be used on the move,” explains Saukh. The team found what it was looking for at the University of Applied Sciences and Arts Northwestern Switzerland; the ultrafine particle sensors developed there are ideal for the Opensense project. The high-quality measurements and automated calibration and maintenance of the sensors were made possible by the ETH researchers’ own strategies and algorithms.
Accurate to 100 metres
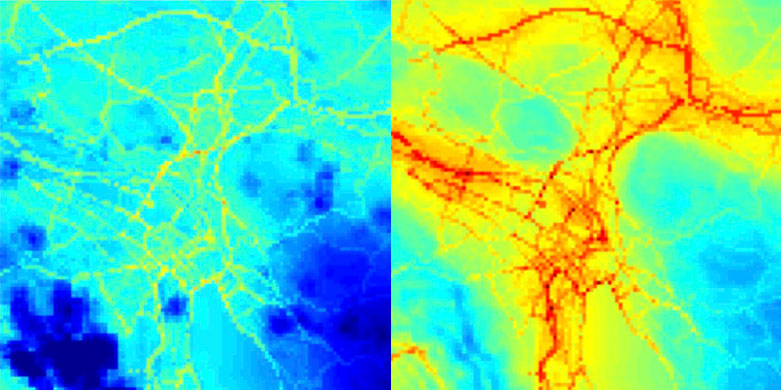
The research team used the data to create pollution maps for the city of Zurich in an unprecedented temporal and spatial resolution. This means that the new maps are accurate to 100 metres and the researchers are able to create yearly, monthly and even daily maps. For instance, the higher concentration of ultrafine particles along the main transport routes in spring is shown clearly as a yellow line. Depending on the weather, the concentrations in winter can increase to such an extent that whole areas of the city are coloured yellow or even red, which denotes a very high concentration.
Detailed insight into air quality
Since people can experience health problems if ozone or ultrafine particle concentrations are too high, there is a great deal of interest in determining the pollution levels in the Zurich area as precisely as possible. The Opensense team is therefore not the only ones measuring air quality. For instance, the external pageNational Air Pollution Monitoring Network (NABEL) of Bafu and Empa operates a measurement station at Zurich-Kaserne. In addition, the external pageOstluft network, consisting of the cantons of eastern Switzerland, regularly measures the pollution values in four locations. “We are in regular contact with these stationary measurement stations, and it speaks volumes for our own measurements that we achieve the same results where comparable data is available to us,” says Saukh. The Opensense researchers are supported by Christoph Hueglin, air quality expert from Empa and a project manager at NABEL. Hueglin is in no doubt: “The results from Opensense enable a detailed insight into the distribution of air pollutants in the Zurich area. However, the measured concentrations fall within the anticipated range.”
Mobile jogging guide
Opensense’s boxes will continue to collect data the length and breadth of Zurich for two more years. In future, data collected on the move could also be accessed using mobile technology, with updated maps in theory accessible at any time via a smartphone. Hasenfratz has some ideas for practical uses: “Joggers or cyclists could, for example, see which routes they should avoid at certain times.”
As the map resolution is so precise, it would also be possible to determine more accurately whether measures to improve air quality are actually effective and where they have the greatest impact. The researchers hope to use this data to draw conclusions about how air quality is affected by transport control measures, such as the Western Bypass, or by use of improved particle filters on vehicles.
A further advantage of the Opensense project is that the relatively low air pollution in Zurich makes it easier to check and improve the accuracy and sensitivity of the measurement system. As a result, it has been possible to use the boxes successfully in other regions; for example, in Asian cities, which have much higher levels of air pollution.
The study is available on the website of the institute.